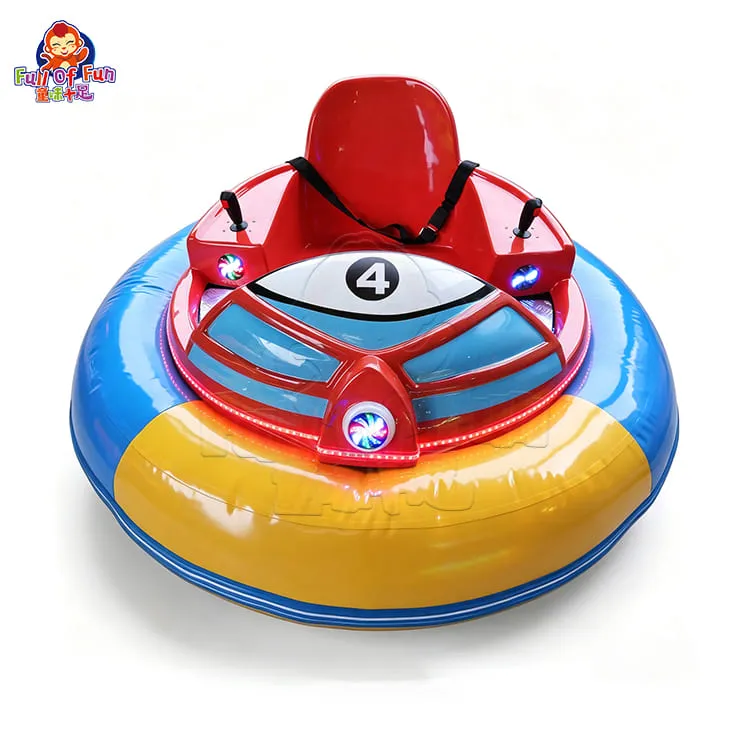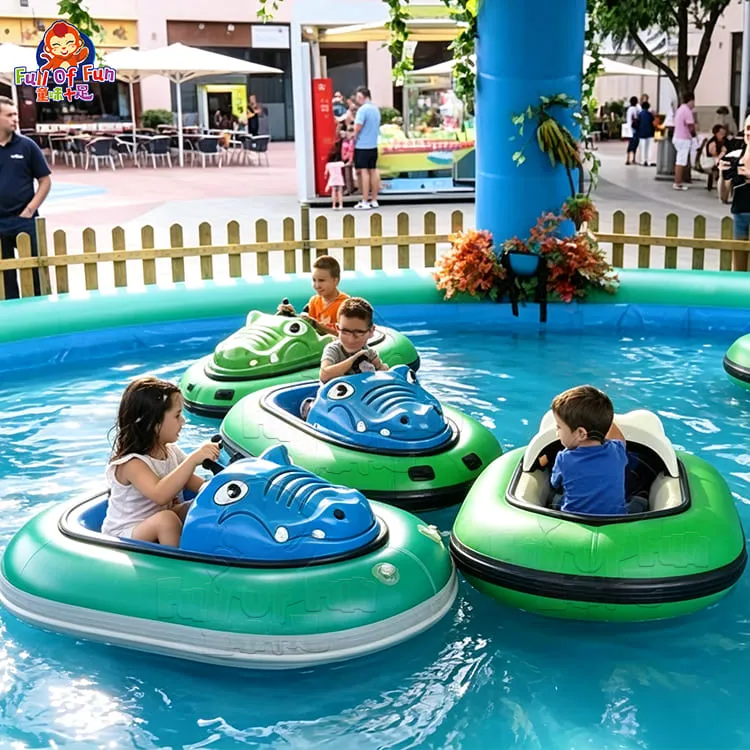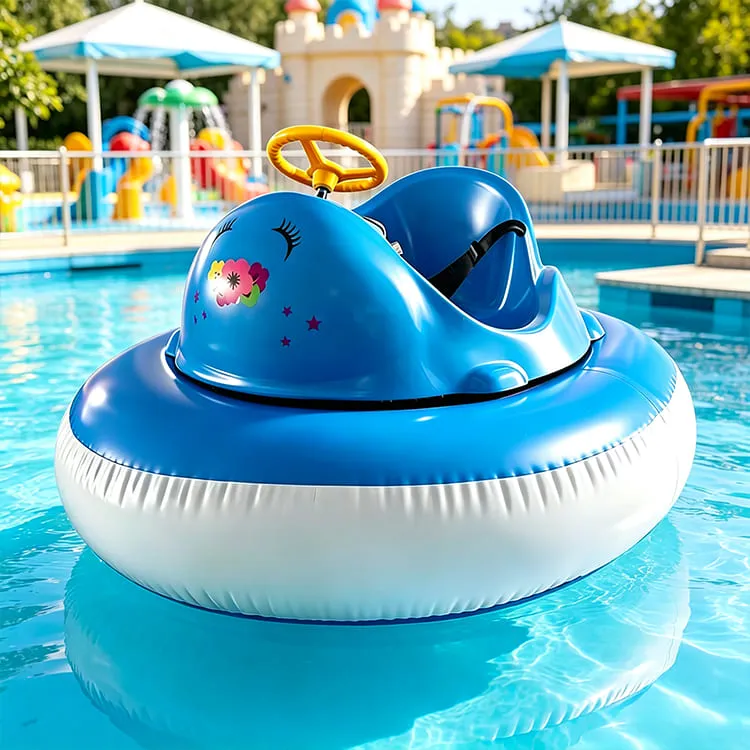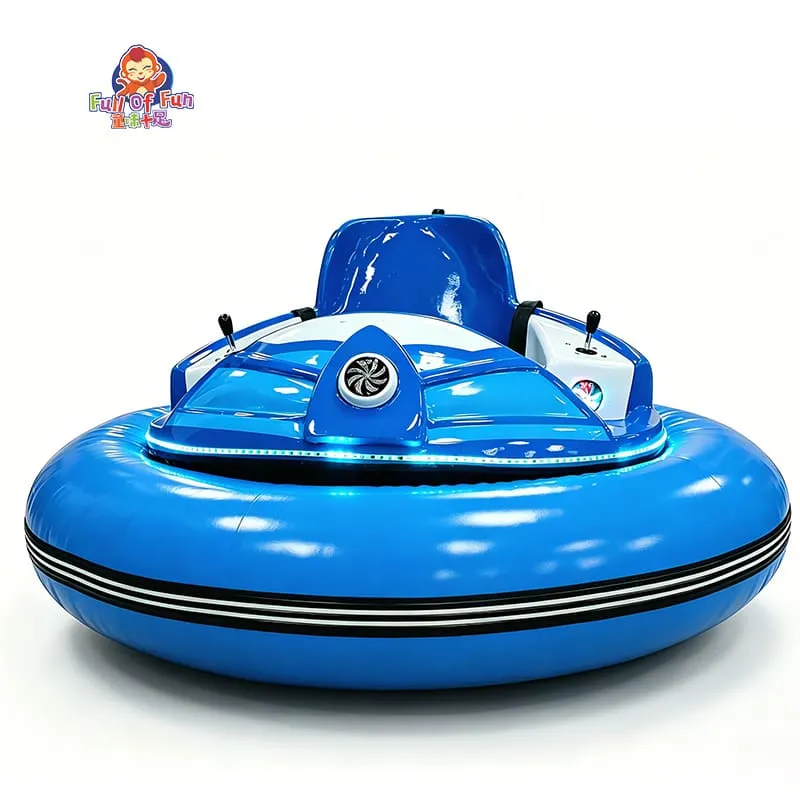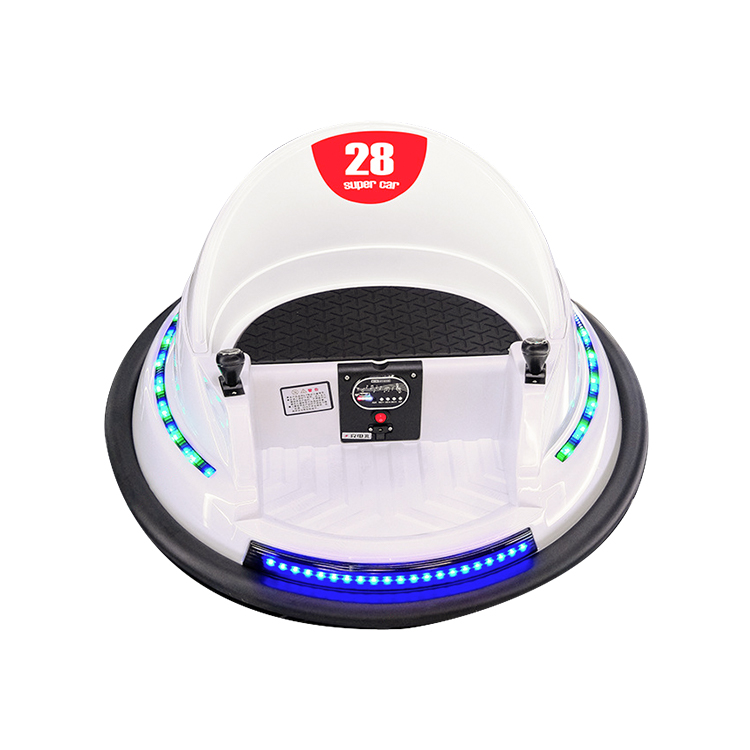

Here’s the short answer: a single well-placed bumper car generates roughly $1,000 to $4,000 in gross profit per month. A high-traffic family entertainment center or a busy summer park can push one unit higher. A slow corner in a quiet mall can leave it idle for hours. (These are industry estimate ranges, explained below. Gross profit here means revenue minus the machine’s direct running costs; rent, staff and marketing sit below that line and vary by venue.)
Those ranges come from 15 years of shipping arcade, ride, and vending equipment to operators in 100+ countries. We see what a bumper car actually pulls in once it’s on the floor, not the hype numbers.
The biggest myth? That the machine makes the money. It doesn’t. Your location, your realized revenue per ride, and how many riders actually climb in per hour make the money. In this guide:
(1) what really drives bumper car revenue,
(2) a 4-lever model to size your income,
(3) a payback formula,
(4) real numbers by venue type,
(5) the three costs that quietly eat your margin.
The Short Answer: Bumper Car Revenue at a Glance
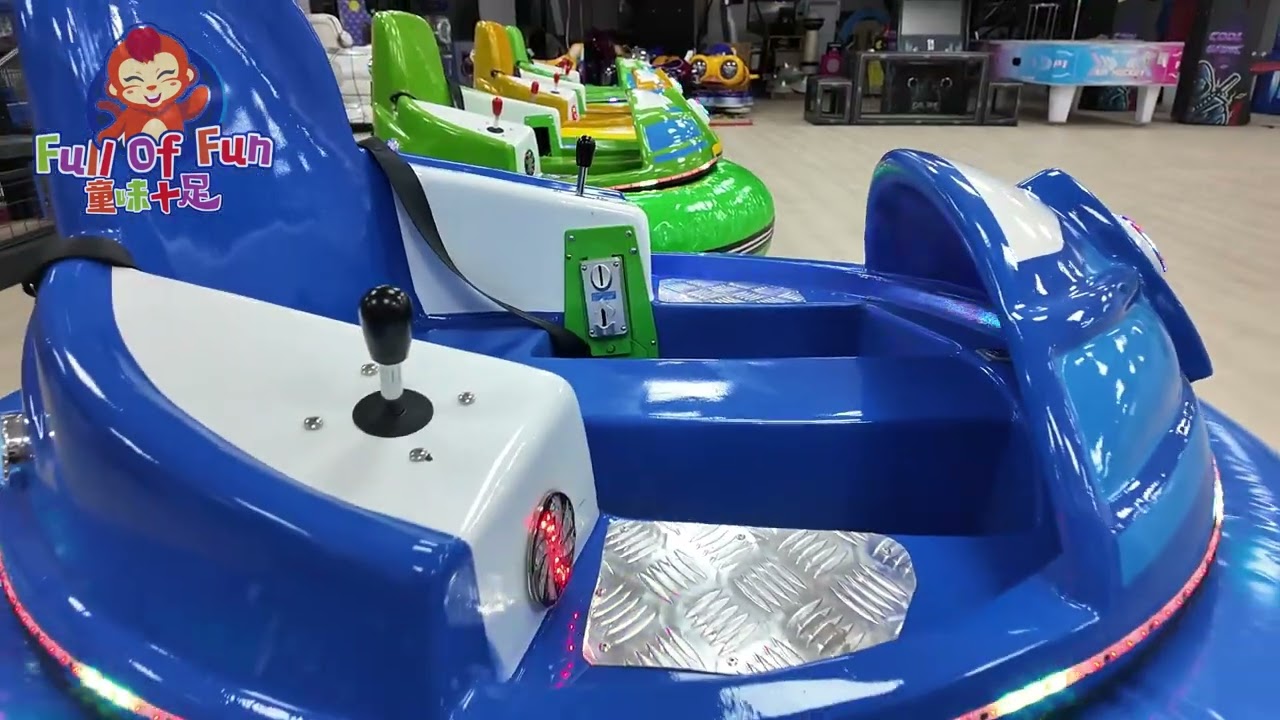
A bumper car is a rent-by-ride asset. It doesn’t sell a product. It sells minutes of fun, over and over, for years. That’s what makes the economics work: the cost is mostly upfront, and the revenue keeps coming.
At a glance, one unit tends to look like this:
- Realized revenue per ride: $2-$5 (industry estimate; often lower than menu price, see below)
- Effective rides per hour, per car: roughly 1-3 on a slow day, 4-7 on an average one, 8-12 when busy (estimate; the machine’s back-to-back ceiling is about 20-25, but no car stays full all day)
- Monthly gross profit, decent location: $1,000-$4,000 (estimate; revenue minus direct running costs; varies widely)
- Direct running cost: roughly 15-25% of revenue (electricity, maintenance, spare parts) (estimate)
- Machine cost: $350-$1,000 per car (Full of Fun pricing)
- Payback: often 2-8 months on the machine cost alone (estimate, covered below)
Two things stand out. First, the machine is inexpensive relative to what it can earn, which is unusual in amusement equipment. Second, the revenue range is wide, because location and how busy you are swing it more than the machine ever could.
Before you count profit, you need to understand what moves the number. That’s next.
What Drives Bumper Car Revenue (and What Doesn’t)
Revenue comes down to one point: a bumper car only earns when someone is sitting in it. Empty cars earn nothing, no matter how good the machine is.
That reframes the whole question. New operators focus on the machine spec. Experienced operators focus on three things instead:
- Foot traffic (footfall). How many people pass your ride per day? A mall atrium with 10,000 daily visitors is a different business from a rural park open on weekends.
- How busy you actually are. A bumper car is rarely occupied every minute you’re open. Mornings are quiet, evenings and weekends are packed, and the off-season can be dead. What matters is the average number of paid rides per hour across the whole day, not the peak.
- Realized revenue per ride. Not your menu price, your actual take per ride after discounts, wristband allocation, and bundle dilution (more on this below).
Here’s what does not move revenue as much as people assume: the color of the car, the number of models on your floor, or a flashy paint job. Those help repeat visits at the margin. They don’t fix a low-footfall site.
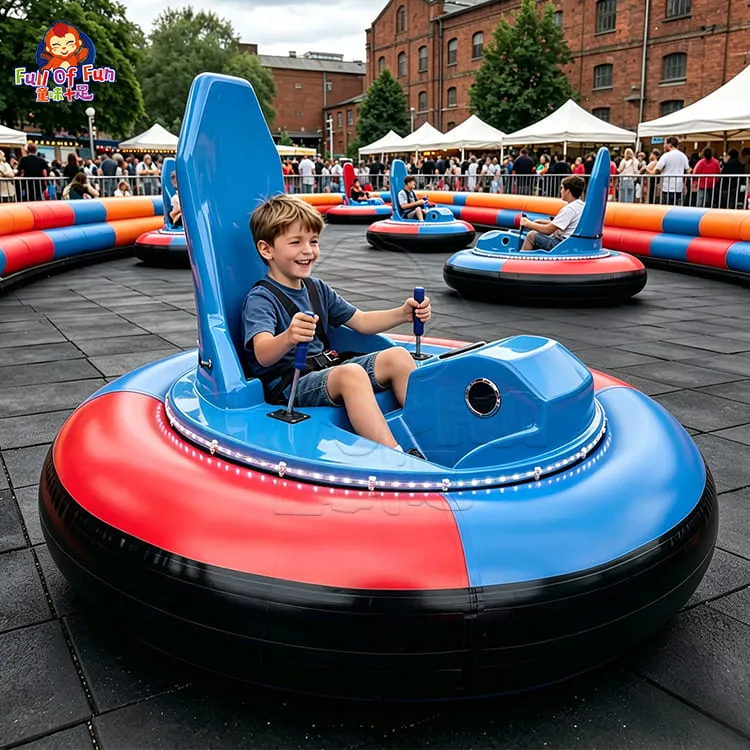
One honest point on battery-powered (floorless) bumper cars: battery runtime sets your ceiling on peak days. A pack that runs 6-10 hours per charge (industry estimate) covers most venues, but on a packed holiday you’ll want spare cars or a charging rotation so nothing sits dead during your best earning window.
If footfall, how busy you are, and realized revenue are the levers, you need a way to turn them into a number. That’s the model below.
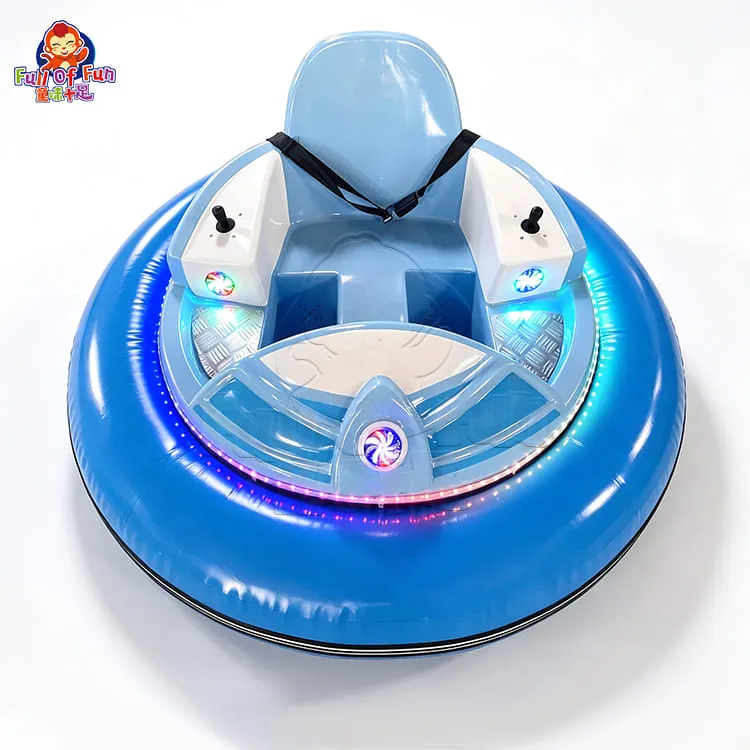
The 4-Lever Bumper Car Revenue Model
Most “how much do bumper cars make” answers give you one vague figure. We use a model instead, one you can plug your own venue into. We call it The 4-Lever Bumper Car Revenue Model, because four inputs decide almost everything:
The key word is effective. A bumper car cycle runs about 2.5-3 minutes, so back-to-back you could theoretically run 20-25 rides an hour. You almost never will. Nobody’s riding at 10 a.m. on a wet Tuesday, and even on a good day the car sits empty between waves. So the honest number is not the machine’s ceiling, it’s how many paid rides actually happen per hour once you average across the full day. That figure swings hard with how busy you are.
Each lever, with realistic ranges (all industry estimates unless noted):
- Lever 1 – Realized Revenue per Ride: $2-$5. This is the lever most guides get wrong. Your menu price and your realized revenue are not the same number. When rides are bundled into an all-access wristband, sold as party packages, or paid with arcade credits, the revenue allocated to each bumper car ride is often lower than the standalone ticket price. Priced and allocated well, wristbands lift how busy you are; priced badly, they quietly dilute your per-ride take. Model the realized figure, not the sign on the wall.
- Lever 2 – Effective Rides per Hour: the number operators most overestimate. It is not the 20-25 back-to-back ceiling. It’s the daily average, and it depends entirely on how busy you are:
- Slow (weak location or off-season): about 1-3 rides per hour. Long dead stretches, only a trickle of riders.
- Average (steady footfall): about 4-7 rides per hour. Quiet mornings, decent afternoons, busy evenings. It averages out in this band.
- Busy (peak season or a high-traffic FEC): about 8-12 rides per hour. Near-constant queues at peak, still real downtime off-peak.
- Lever 3 – Operating Hours per Day: 8-12 for most venues; seasonal parks compress this into weekends and holidays.
- Lever 4 – Operating Days per Month: roughly 26-30 for a permanent indoor site, far fewer for a seasonal or weekend-only operation.
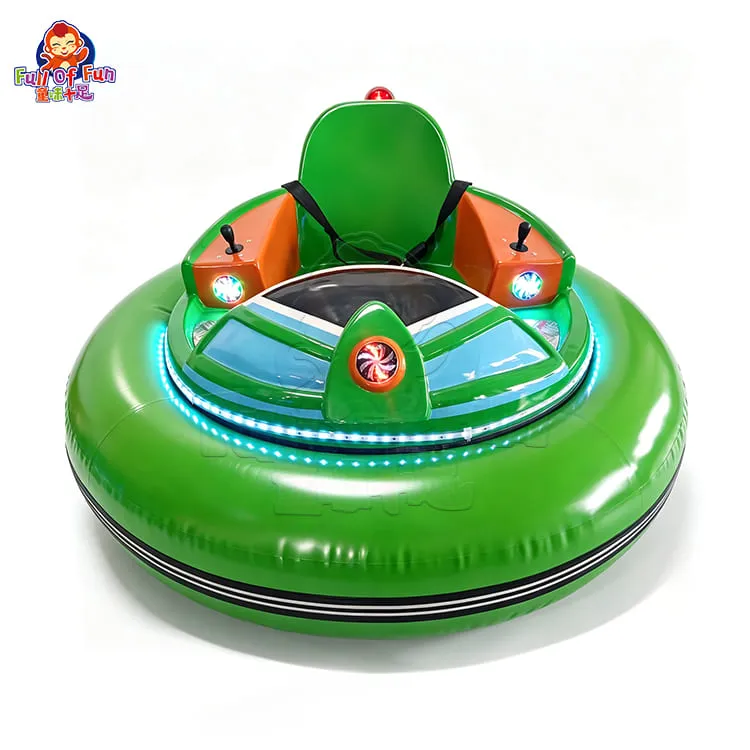
Now three worked scenarios, all using the same $3 realized ride, so you can see how much “how busy you are” changes everything (illustrative estimates, per single car):
| Business level | Effective rides/hour | Hours/day | Days/month | Revenue/month | Gross profit/month |
|---|---|---|---|---|---|
| Slow (weak footfall) | 2 | 8 | 24 | ~$1,150 | ~$860-980 |
| Average (steady) | 5 | 10 | 28 | ~$4,200 | ~$3,150-3,570 |
| Busy (peak / high-traffic FEC) | 10 | 11 | 30 | ~$9,900 | ~$7,400-8,400 |
That last column is the honest one. A bumper car is cheap to run: its direct operating costs (electricity, maintenance, and spare parts) typically eat only 15-25% of revenue, so gross profit lands around 75-85% of what the car takes in. That is unusually high for amusement equipment, and it’s why the ride pays back so fast. Note that this gross figure is before venue rent, staff wages, and marketing, which sit below the gross line and swing hard by location, so we keep them out of the per-car math. Same machine, same $3 ride. The only thing that changed across those three rows was how many people actually climbed in. That is the whole business.
Strong gross profit is only half the story. To know how fast the car pays for itself, you need the payback math.
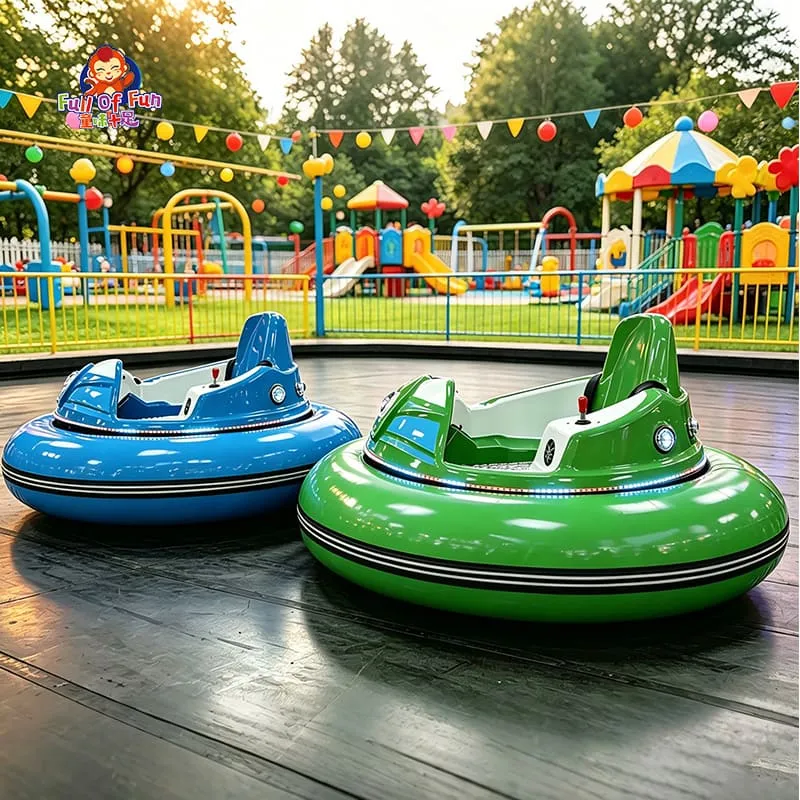
The Bumper Car Payback Formula
Payback period is the question that decides purchases: how fast do I get my money back? Here’s the formula we walk operators through, The Bumper Car Payback Formula:
Two inputs, two honest definitions:
- Machine Cost = the price of the car itself. A Full of Fun bumper car runs $350-$1,000 per unit (a real price range, and our MOQ is just 1 car, so you can start small). Freight and any flooring or barrier are extra, and we treat them separately because they vary so much by destination and venue.
- Monthly Gross Profit = revenue (from the 4-lever model) minus the car’s direct running costs (electricity, maintenance, spare parts), which run about 15-25% of revenue. This is the gross figure from the table above, before rent and staff.
Worked scenario, single car:
Take a mid-range $700 machine in a slow-to-average location earning $900/month gross profit (conservative estimate):
Payback = $700 / $900 = under 1 month of gross profit.
Even a top-price $1,000 car in a genuinely slow spot (~$860 gross) clears the machine cost in about 1 month. Load in freight, flooring, and barriers, and the full setup still typically pays back in 2-8 months (estimate), depending on venue type and how busy you are. The machine is rarely the thing that holds payback back; footfall is.
Run it for your own venue before you buy anything. As a rough screening rule (C-level estimate, not a hard number): if your honest rides-per-hour estimate pushes full-setup payback past roughly 18 months, the site is likely too slow. Fix the location or the realized revenue, not the machine.
Numbers in a formula are one thing. Numbers by real venue type are more useful, so here’s the breakdown.
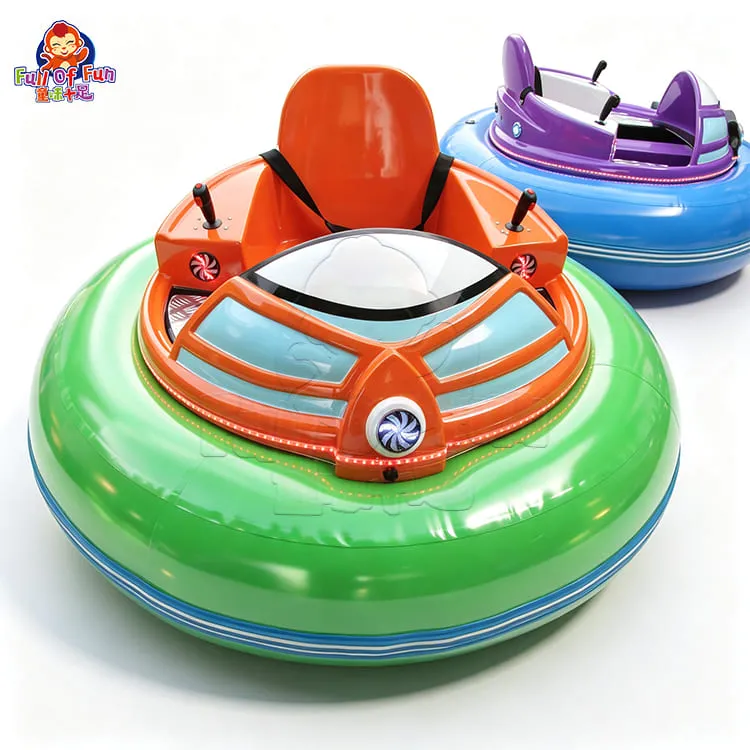
Real Numbers by Venue: FEC vs Park vs Mall Pop-Up
Averages hide the truth. The same bumper car behaves differently across venue types. Below is our comparison (all figures are industry estimate ranges, per single car; gross profit = revenue minus direct running costs, before rent and staff):
| Venue type | Realized/ride | Effective rides/hour | Monthly gross profit/car | Machine-cost payback |
|---|---|---|---|---|
| Indoor FEC (family entertainment center) | $3-$5 | 5-10 | $3,500-$11,600 | under 1 month |
| Outdoor amusement park (seasonal) | $2-$4 | 3-8 (peak-heavy) | $800-$6,700 | 1-2 months |
| Mall pop-up / event rental | $3-$5 | highly variable | $1,500-$7,100 | varies by contract |
A few honest reads on this table:
- FECs win on consistency. Climate-controlled, year-round footfall, and repeat families. This is where bumper cars quietly earn their keep, and where spin models can command a price premium.
- Parks win on volume but fight seasonality. A summer weekend can outrun any FEC; January can be zero. Budget for the off-season.
- Mall pop-ups and event rentals are the wild card: strong margins when the contract and footfall align, dead when they don’t. Fast-setup formats suit this best.
Not sure which venue math fits your space? Chat with us about your location and we’ll sanity-check the numbers with you before you spend a dollar.
The Profit Killers: 3 Costs That Eat Your Margin
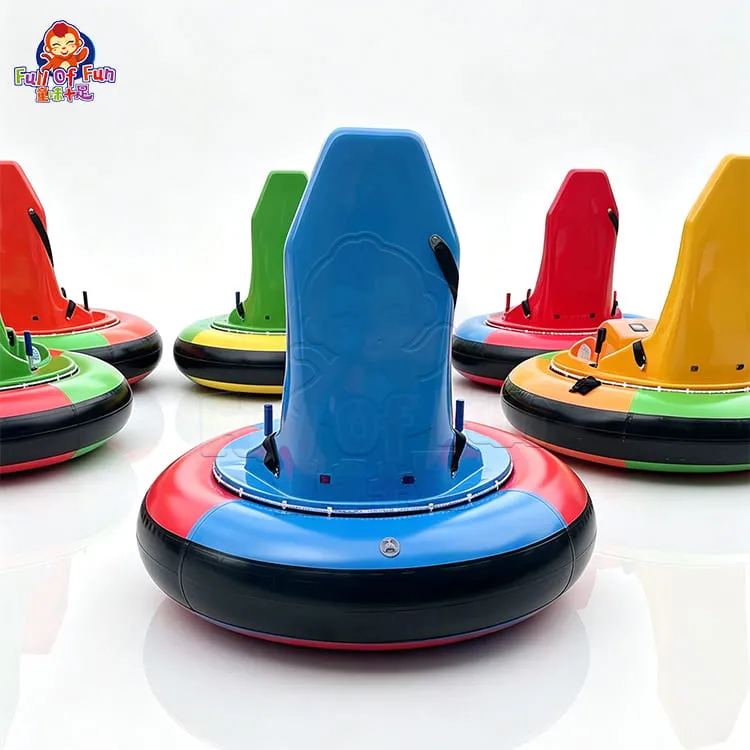
A bumper car is cheap to buy and cheap to run, until it isn’t. Three costs quietly drain margin, and all three trace back to the machine choice.
- 1. Battery degradation.
Battery-powered bumper cars lose runtime as the pack ages. A car that ran 8 hours new might reach only 5 after a couple of seasons of hard use (industry estimate). That means dead cars during your peak evening window, the exact hours you can’t afford to lose. Lithium packs hold up better than older lead-acid setups, and matching pack capacity to your daily hours protects your Lever-3 income. - 2. Floor and contact-band maintenance.
Bumpers take a beating. Worn rubber bands, scuffed floors, and loose trim don’t stop the ride, but they make it look tired, and tired rides lose repeat riders. Budget a small monthly upkeep line; it’s cheaper than lost footfall. - 3. Buying the wrong type for the venue.
This is the expensive one. Put an inflatable set in a permanent FEC and it wears out fast; put a heavy adult car in a kids’ zone and it scares off your core riders. Getting the type right matters more than any single spec, and it’s a decision worth making before you model ROI, not after. We cover all of that separately: our bumper car sourcing guide for amusement parks, arcades, and entertainment venues breaks down the types, safety design, and what to check before you buy.
Get these three under control and the venue tables above hold up. Miss them and even a great location underperforms. This is where the machine you choose starts to matter.
How Full of Fun Helps Operators Protect ROI
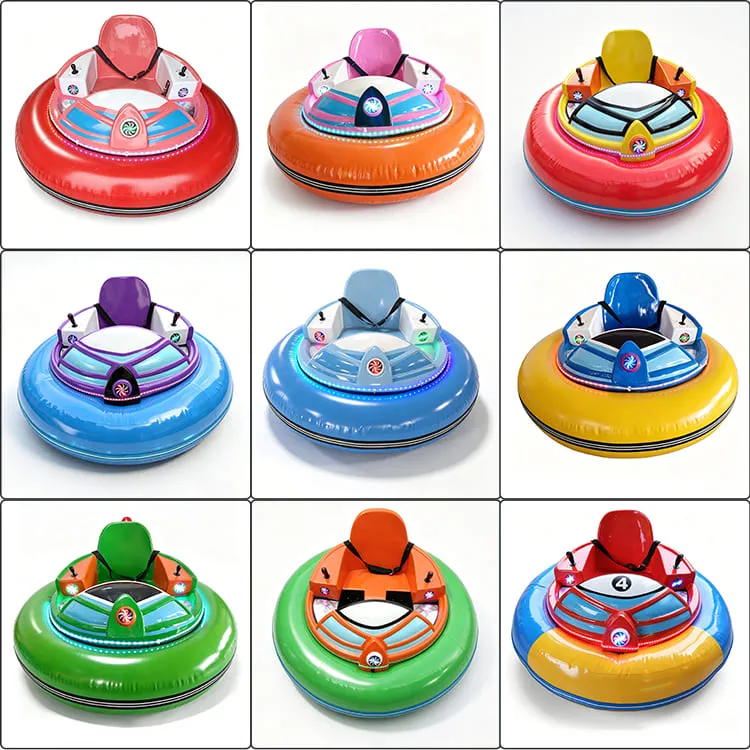
Everything above is vendor-neutral math. But once you’ve run the numbers, the machine you pick decides whether those numbers survive a busy weekend. Here’s how we build bumper cars to protect the levers you just calculated.
- Lithium battery options for longer daily runtime. We spec battery packs to your operating hours so cars stay live through your peak earning window, protecting Levers 2 and 3.
- Durable contact materials. Reinforced bumpers and quality floor components cut the maintenance line that eats margin over a season.
- The right type for your venue. We help you match type to footfall instead of overpaying for the wrong one. (For the full type-by-type comparison, see the sourcing guide linked above.)
- Customization. Branding, colors, and lighting to lift repeat rides without changing the underlying economics.
- MOQ of 1. You can start with a single car to test a location before scaling. No forced bulk order to prove the model.
We build this way after 15 years of watching operators lose money to dead batteries and mismatched machines.
Why Operators Choose Full of Fun
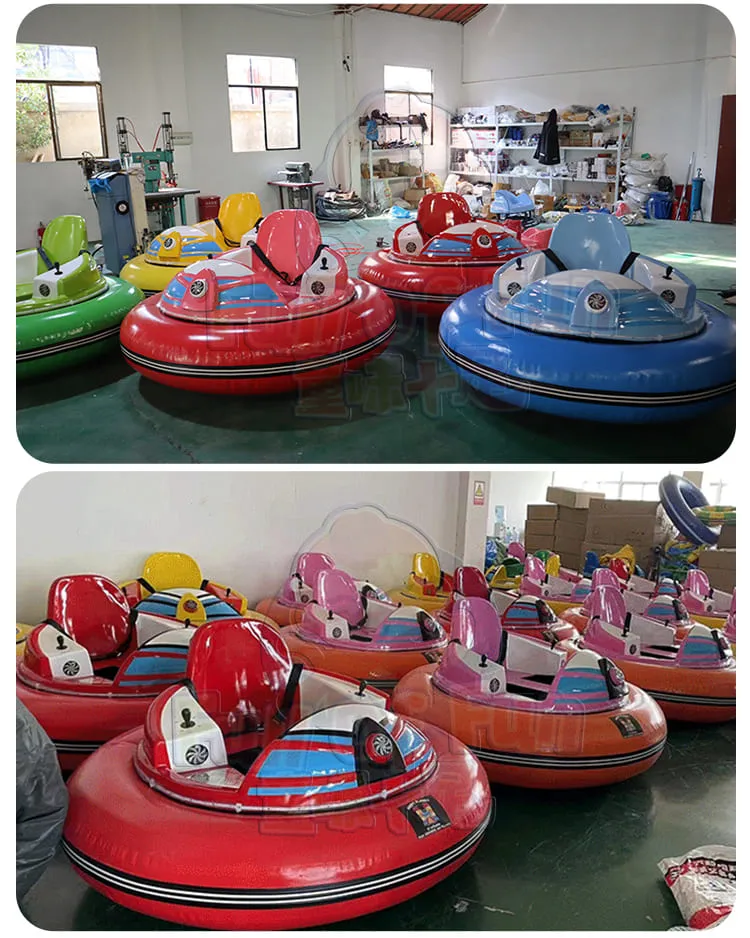
When you’re putting capital into a ride, the supplier matters as much as the machine. A few reasons operators in 100+ countries work with us:
- 15 years shipping amusement equipment to family entertainment centers, parks, and venues worldwide.
- Transparent pricing: bumper cars from $350-$1,000 per car, with an MOQ of 1 so you can start small.
- Compliance: our equipment is manufactured to meet CE and RoHS requirements in the applicable scope. Confirm the exact certificate set for your model and destination market with our team.
- End-to-end support: sourcing help, customization, spare parts, and after-sales guidance so your ROI survives past year one.
We’d rather help you buy the right car once than sell you the wrong one twice.
Frequently Asked Questions
How much does a single bumper car earn per month?
In a decent location, a single bumper car generates an estimated $1,000-$4,000 in gross profit per month (revenue minus its direct running costs, before rent and staff). A slow, off-season site can fall well below that; a busy high-traffic FEC can clear well above it. Because the direct running cost is low (about 15-25% of revenue), most of what the car takes in is gross profit. Your realized revenue per ride, footfall, and how busy you actually are move the number more than the machine itself.
How many rides per hour does a bumper car really get?
Back-to-back, the machine can cycle roughly 20-25 rides an hour, but no car stays full all day. The honest, averaged figure is about 1-3 rides per hour when business is slow, 4-7 on an average day, and 8-12 when you’re busy (industry estimates). Model the average across your full opening hours, not the peak.
How much does a bumper car cost to buy?
Full of Fun bumper cars run $350-$1,000 per car, depending on type and customization. Our minimum order is just 1 car. Add freight and any flooring or barrier costs on top of the machine price.
What is the payback period on a bumper car?
Using our payback formula (Machine Cost / Monthly Gross Profit), a single car often clears its own purchase price in under a month to a couple of months of gross profit. Across a full ride setup with freight, flooring, and barriers, most operators estimate a 2-8 month payback, depending on venue type and how busy the location is.
Should bumper cars be sold per ride or included in a wristband?
Both work, but they change your math. Per-ride pricing gives you a clean realized revenue figure. All-access wristbands can lift how busy the cars stay and boost dwell time, but only if the ride revenue is allocated and priced correctly, otherwise they dilute your per-ride take. Model the realized number either way.
Are bumper cars a good investment in 2026?
For operators with real footfall, yes. The machine cost is low relative to its earning life, and demand for physical, social attractions stays strong. The risk isn’t the ride; it’s putting it in a low-traffic spot. Run the 4-lever model on your actual venue first.
How many bumper cars should I buy for my venue?
It depends on floor space and footfall. Many operators start with a small fleet to test how busy the cars get, then scale. Because our MOQ is 1, you can validate a location with a single car before committing. Chat with us with your square footage and we’ll suggest a starting count.
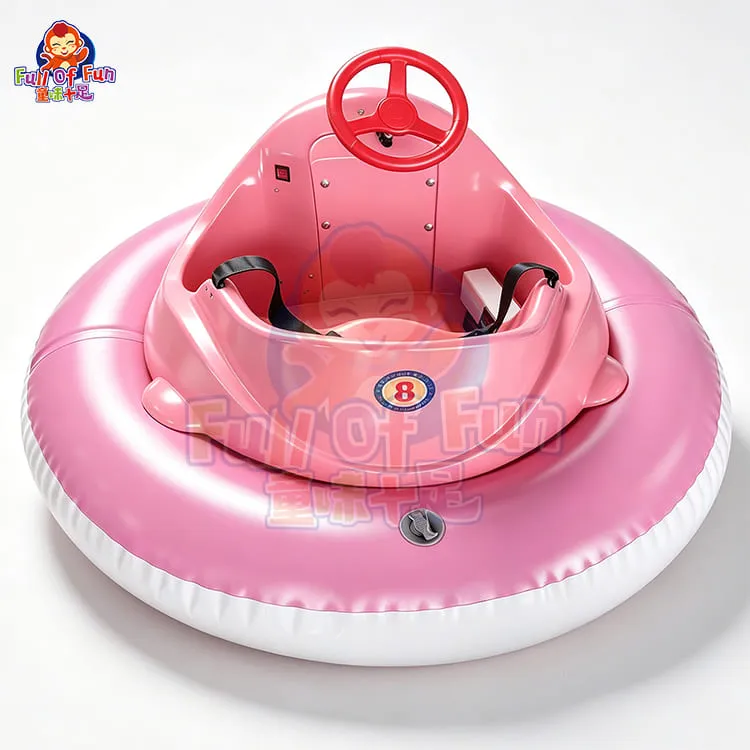
Your Next Step: From Numbers to Machines
You now have the math: the 4-lever revenue model, the payback formula, and real numbers by venue type. The next step is matching those numbers to the right machine.
Start here:
- Not sure which type fits your space? Read our bumper car sourcing guide for amusement parks, arcades, and entertainment venues for a full breakdown of types, safety design, and purchasing factors.
- Want the numbers checked against your venue? Chat with us about your location, no commitment, just a sanity check on your footfall and how busy the cars are likely to be.
- Ready for pricing? Send your inquiry for a custom quote. With an MOQ of 1 and pricing from $350-$1,000 per car, you can start with a single unit and scale as the numbers prove out.
Let’s turn your floor space into a ride that pays for itself.