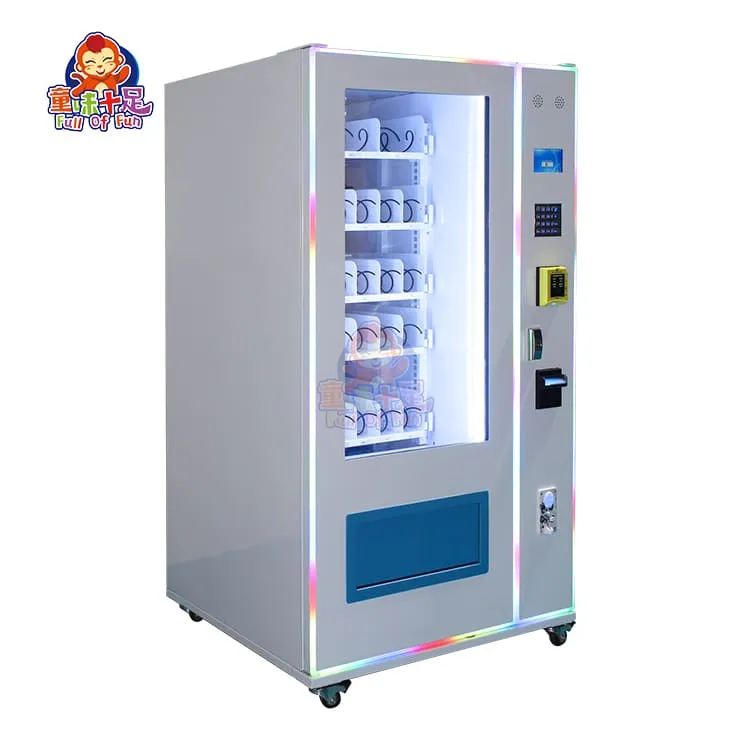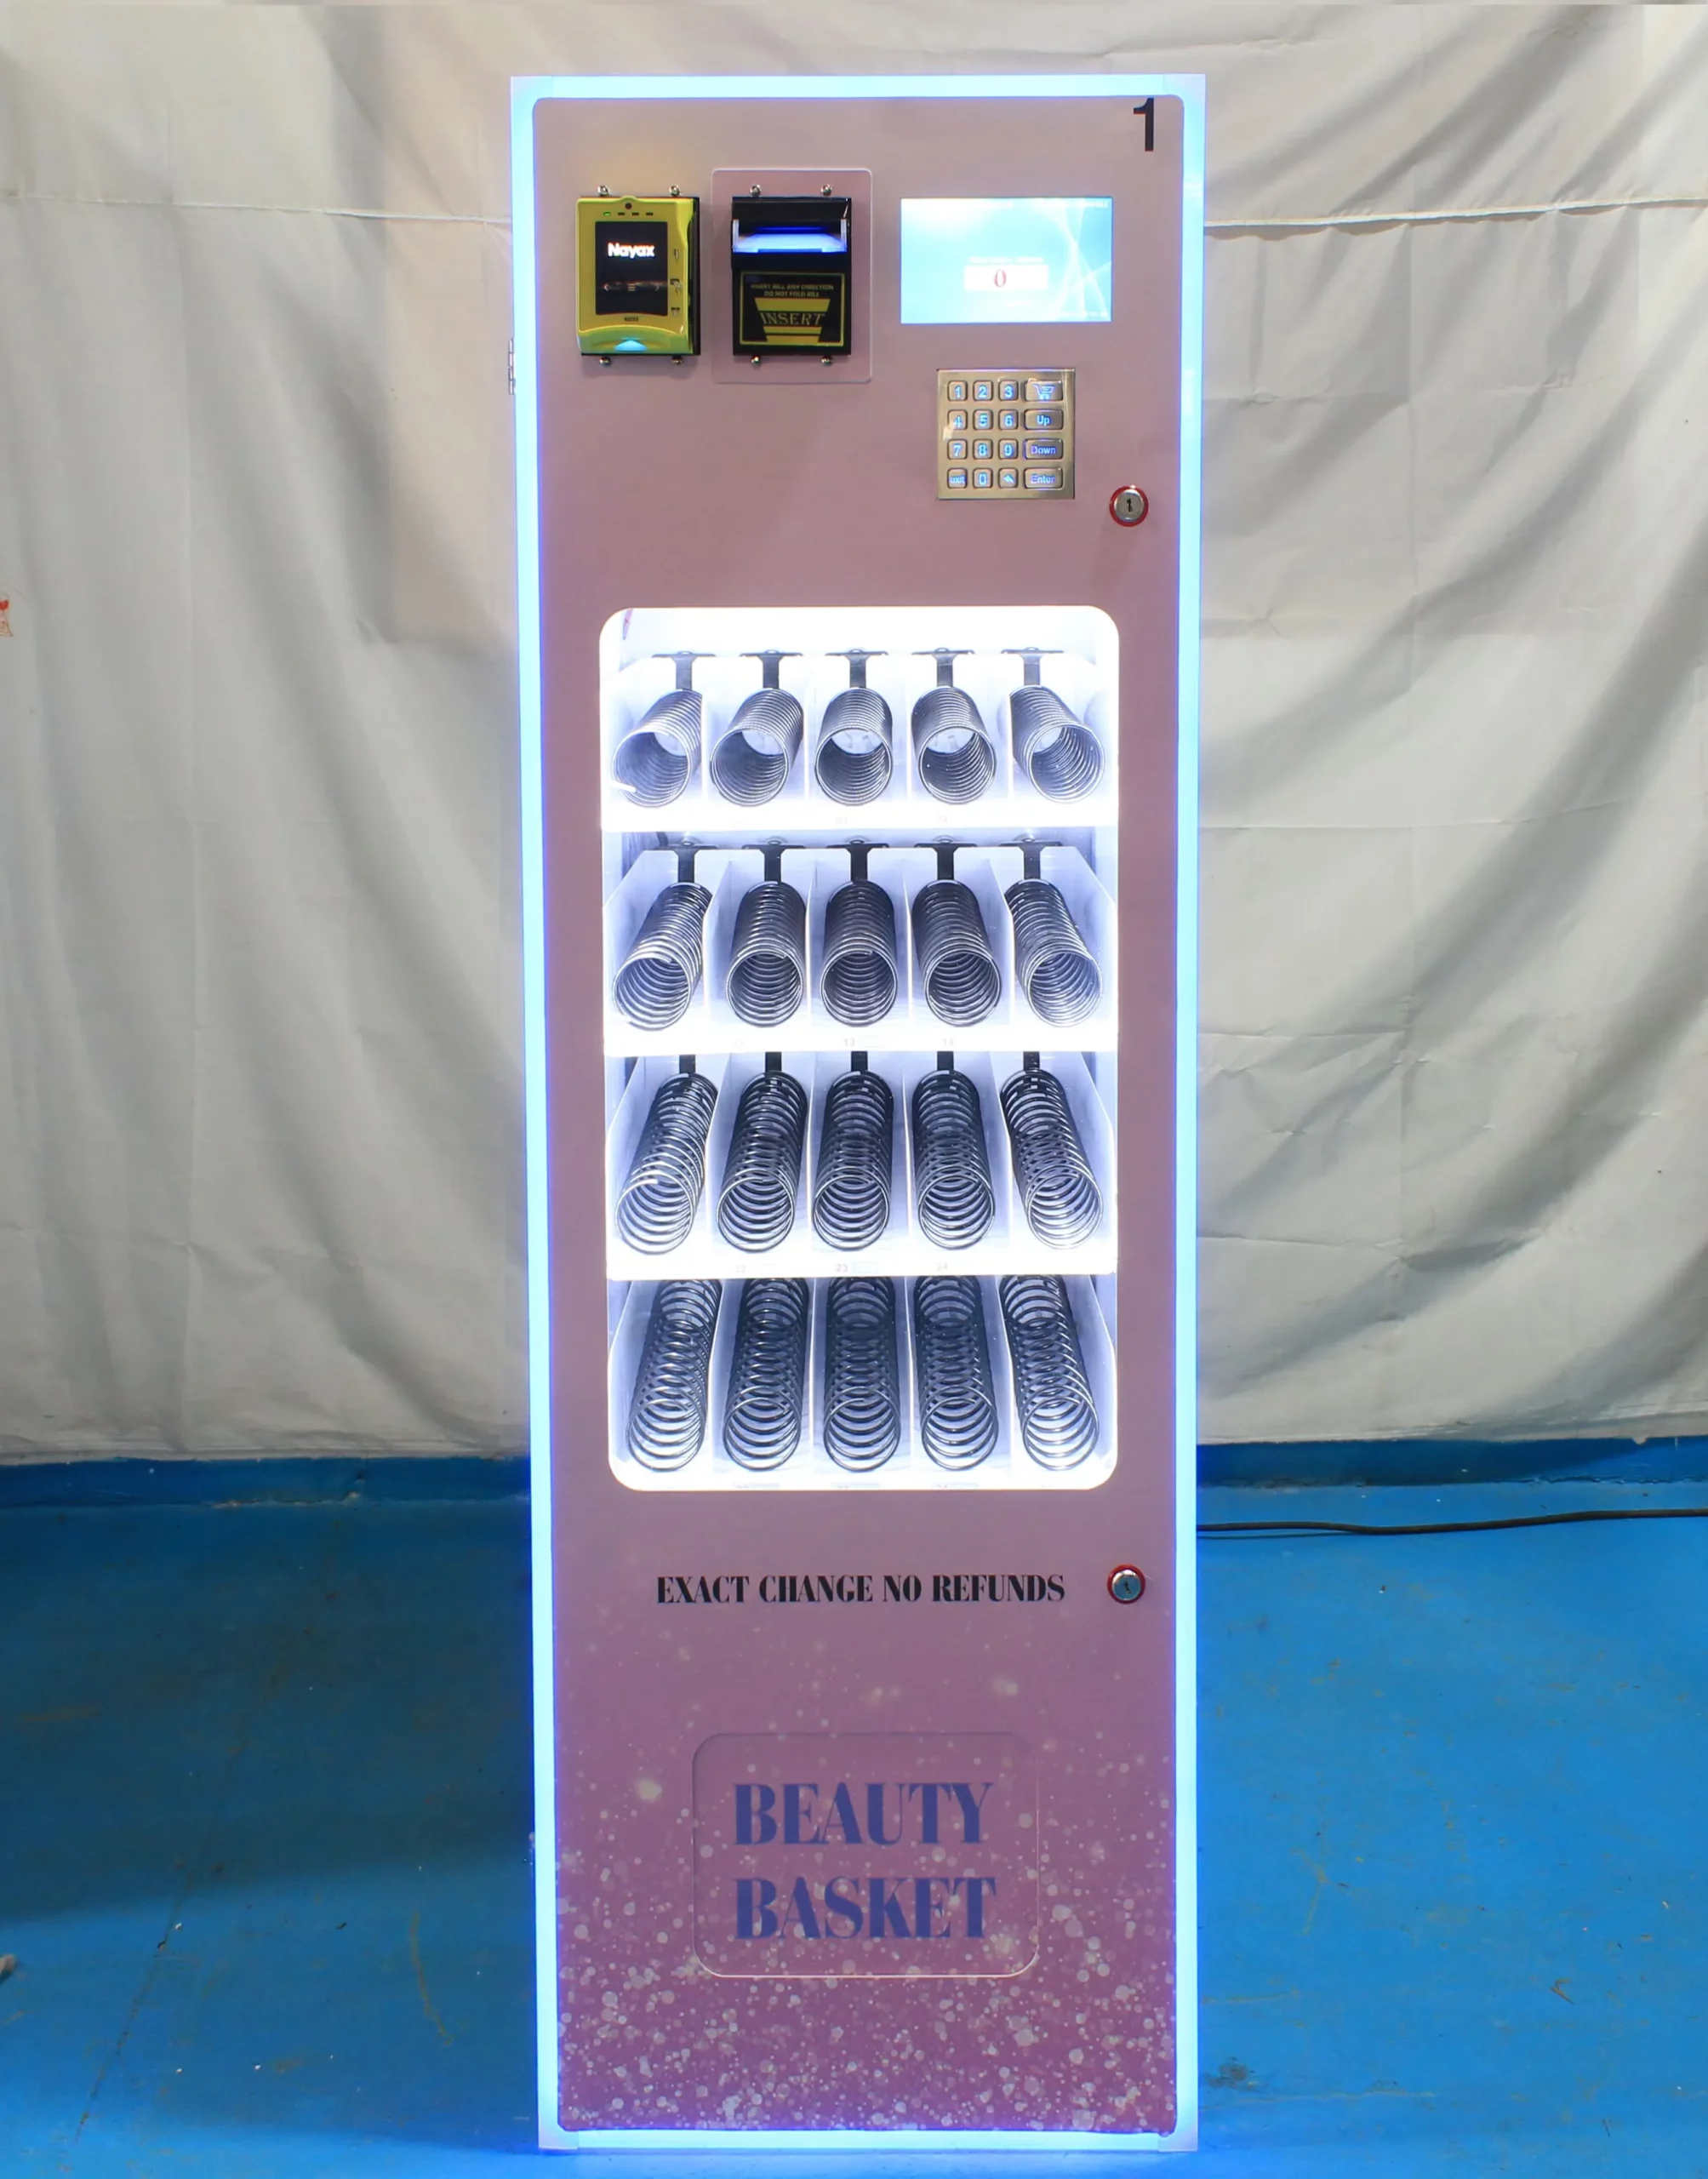

For commercial property investors, family entertainment center (FEC) operators, and retail venue managers, automated retail solutions represent a resilient strategy for generating passive revenue. Because these systems operate 24/7 without on-site human intervention, calculating the precise payback period is central to capital allocation.
Simply put, your payback timeline is determined by your placement location, product strategy, and operational efficiency. This comprehensive analysis evaluates vending machine profitability across diverse scenarios to help you maximize your return on investment (ROI).
Quick Answer: Executive ROI Summary
Executive Summary
On average, a high-quality commercial vending machine pays for itself within 6 to 12 months. With an initial capital expenditure (CapEx) ranging between $2,000 and $3,000 per unit (including shipping and initial stock), a well-placed machine generates a monthly net profit of $300 to $450. In premium, high-traffic corridors like airports or hospitals, the payback window can compress to under 6 months.
Key Takeaways
- Average Payback Window: 6 to 12 months under standard operating conditions.
- Initial Unit Cost: $2,000 to $3,000 (factory-direct import pricing).
- Primary Profit Drivers: Foot traffic density, dwell time, and a high-margin product mix.
- Target Net Profit Margin: 30% to 50% of gross monthly revenues.
Fast-Fact ROI Matrix
| Metric | Baseline Performance | Premium Location Performance |
|---|---|---|
| Initial Unit Investment | $2,000 – $3,000 | $2,000 – $3,000 |
| Average Daily Revenue | $20 – $30 | $40 – $60+ |
| Estimated Monthly Net Profit | $100 – $300 | $300 – $450+ |
| Proven Payback Timeline | 6 – 10 Months | < 6 Months |
1. Core Financial Determinants of Vending Machine Payback
To calculate your exact breakeven horizon, you must evaluate the variables that dictate day-to-day profitability.
   [Placement Location] + [Product Mix] + [Machine Reliability]
   -------------------------------------------------------------  = High ROI & Fast Payback
                       [Operating Costs]
Strategic Placement Location
Location is the primary factor driving automated retail profitability. The ideal site requires a combination of high foot traffic and high dwell times (waiting intervals).
- Premium Locations: Schools, medical centers, transit hubs, and corporate complexes ensure a steady stream of captive consumers. High-traffic environments naturally elevate purchase intent and conversion rates.
- Low-Traffic Locations: Areas with minimal foot traffic or highly distributed pedestrian paths extend the payback window significantly due to lower daily transactions.
Product Mix and Margin Optimization
Offering products that align with local consumer demographics directly scales sales volume. Diversifying your inventory across beverages, snacks, and daily essentials attracts a broader customer base and drives repeat purchases. High-margin inventory (such as bottled water, functional beverages, and specialty snacks) accelerates your breakeven timeline.
Equipment Quality and Operational Sourcing
Deploying robust, commercial-grade equipment with low component failure rates is vital for preserving long-term margins. Frequent technical glitches disrupt the user experience and trigger immediate revenue losses. Consistent automated inventory tracking and scheduled maintenance protocols protect your daily cash flow.
Tightly Managed Operating Costs
Total operational expenditures (OpEx) consist of inventory procurement, logistics, routine servicing, site lease/commission fees, and utility overhead. Minimizing supply chain inefficiencies and automating route logistics directly preserves your net margins.
2. Granular Profit & Margin Analysis
A standard commercial vending machine in a secure, mid-to-high-traffic zone typically generates a gross revenue of $300 to $600 per month.
After accounting for cost of goods sold (COGS), site commissions, and maintenance overhead, the machine yields a net profit of $100 to $300 per month. This translates to a sustainable 30% to 50% net profit margin.
Monthly Financial Performance by Location Type
| Location Profile | Foot Traffic Density | Average Gross Monthly Revenue | Net Profit Margin | Realized Monthly Net Income |
|---|---|---|---|---|
| Tier 1 (Airports, Major Hospitals) | Extreme / Constant | $600 – $1,000+ | 45% – 50% | $300 – $500+ |
| Tier 2 (Colleges, Shopping Malls) | High / Cyclical | $450 – $600 | 35% – 45% | $160 – $270 |
| Tier 3 (Office Blocks, Local Gyms) | Moderate / Static | $300 – $450 | 30% – 35% | $100 – $160 |
3. The Payback Timeline: Data-Driven Projections
Evaluating your payback period requires aligning your upfront equipment costs with realistic, data-backed operational modeling.
Payback Period (Months) = Initial Capital Expenditure (CapEx) ÷ Monthly Net Profit
Capital Expenditure (CapEx) Breakdown
When sourcing directly from an established manufacturer, the baseline cost of a professional vending machine ranges from $2,000 to $3,000. This figure covers international freight, custom branding configurations, and primary payment processing integration.
Capital Allocation Profile
- Base Machine & Freight Logistics: $2,000 – $3,000
- Opening Inventory Stocking: $200 – $400
- Working Capital (Permits/Site Deposit): $150 – $300
- Total Initial Capital Allocation: $2,350 – $3,700
4. Real-World Case Studies: ROI Breakdown & Pitfalls to Avoid
Case Study A (Success): High-Yield FEC Deployment in Ohio, USA
Customer Background: A mid-sized Family Entertainment Center (FEC) operator managing a high-volume 15,000 sq. ft. arcade and indoor playground facility.
Specific Case: The operator integrated 3 customized, dual-zone chilled beverage and snack combo vending machines near the parents’ waiting lounge and the main prize redemption counter. The units offered a targeted inventory of high-margin energy drinks, premium juices, and quick-grab healthy snacks.
Financial Data Breakdown:
- Total Initial Investment (CapEx): $8,400 (for 3 units including custom wraps and sea freight).
- Monthly Gross Revenue: $2,250 ($750 per machine).
- Net Profit Margin: 46% (driven by high-margin functional beverages).
- Monthly Net Income: $1,035 total.
- Realized Payback Period: 8.1 Months.
Case Study B (Failure): The Unbranded “Low-Cost” Equipment Trap in Birmingham, UK
Customer Background: A commercial facilities manager supervising vending assets across a multi-tenant suburban corporate office park.
Specific Case: Seeking to save money upfront, the manager purchased 4 unbranded, heavily discounted smart vending machines from an unverified online marketplace liquidator rather than an established factory manufacturer. The units lacked localized payment system compatibility and reliable cloud telemetry systems.
Financial Deficit Breakdown:
- Initial “Saved” CapEx: $3,500 lower than premium factory alternatives.
- Operational Failure: Within 60 days, persistent note-validator jams and software connectivity sync drops caused an average daily downtime of 42%.
- After-Sales Deficit: The liquidator offered no tech support. Sourcing replacement parts independently took 5 weeks, costing an extra $1,200.
- Revenue Loss: Because there was no automated out-of-stock monitoring, machines sat empty frequently. Actual monthly revenue fell to $110 per machine, failing to clear basic site overhead.
- Total Realized Deficit: The operator abandoned the equipment after 9 months, incurring a total net loss of over $6,800.
Lessons from the Field
Upfront savings on unverified, unbranded hardware are quickly wiped out by operational downtime. Securing a fast payback window requires stable hardware equipped with cloud telemetry and backed by direct manufacturer support.
5. Advanced Strategies to Accelerate Your Breakeven Timeline
To shorten your payback period and increase your overall yield, implement these industry-proven operational practices:
- Prioritize High-Dwell Locations: Target locations where consumers experience natural wait times, such as hospital waiting rooms, airport gates, and automotive service lounges.
- Leverage Dynamic, Data-Driven Inventory Tracking: Use integrated telemetry tools to analyze product performance in real time. Quickly replace slow-moving items with high-margin alternatives like healthy snacks or specialized energy drinks to keep purchase frequencies high.
- Maximize Operational Efficiency: Minimize down-time through preventive component checks and optimized restocking schedules. Ensuring the machine stays fully stocked prevents lost sales from empty product slots.
- Optimize Your Supply Chain: Source your inventory from bulk wholesale distributors to reduce unit costs. Streamlining your refilling routes also lowers fuel and labor expenses, keeping your operating margins healthy.
6. B2B Frequently Asked Questions (FAQ)
What is the average lifespan of a commercial vending machine?
When sourced from an established manufacturer and maintained regularly, a commercial vending machine operates reliably for 8 to 12 years. This extended lifespan ensures years of steady, passive revenue long after your initial investment is recovered.
How much are typical monthly site leasing or rental fees?
Site rent varies based on the venue type. Operators generally use one of two structures: a fixed monthly rent ranging from $50 to $150, or a percentage-based commission of 5% to 15% of gross sales. For locations with lower foot traffic, try negotiating a pure profit-share model to limit your fixed overhead risk.
Do smart payment systems affect user transaction rates?
Yes, installing credit card readers, mobile tap options (Apple Pay/Google Wallet), and QR code payment systems can increase total transaction volume by 20% to 35%. Providing cashless options removes barriers to purchase, especially for higher-priced items.
What are the power requirements and average utility costs?
Modern commercial machines are engineered for energy efficiency, utilizing smart cooling cycles and LED displays. Standard power configurations run on typical 110V/220V lines, resulting in an average utility cost of just $10 to $30 per month per machine.
How does remote telemetry software simplify scaling a route?
Cloud-based telemetry provides real-time updates on inventory levels, cash balances, and component status. This data helps operators organize efficient restocking routes, saving on labor and vehicle costs while ensuring machines never run out of top-selling items.
7. Why Partner with Full of Fun Vending Machines?
Premium Engineering Meets High-Yield Commercial Value
Choosing a high-quality, stable manufacturing partner is the most critical decision for ensuring a fast payback period. Full of Fun delivers commercial-grade automated retail systems designed for optimal operational efficiency and maximum asset longevity.
1. Robust Build Quality and Long-Term Reliability
Full of Fun machines are constructed using premium materials and advanced components, making them resilient under heavy use. Each machine undergoes rigorous factory testing to ensure exceptionally low failure rates, lowering your ongoing maintenance costs and protecting your daily cash flow.
2. Versatile Product Layouts
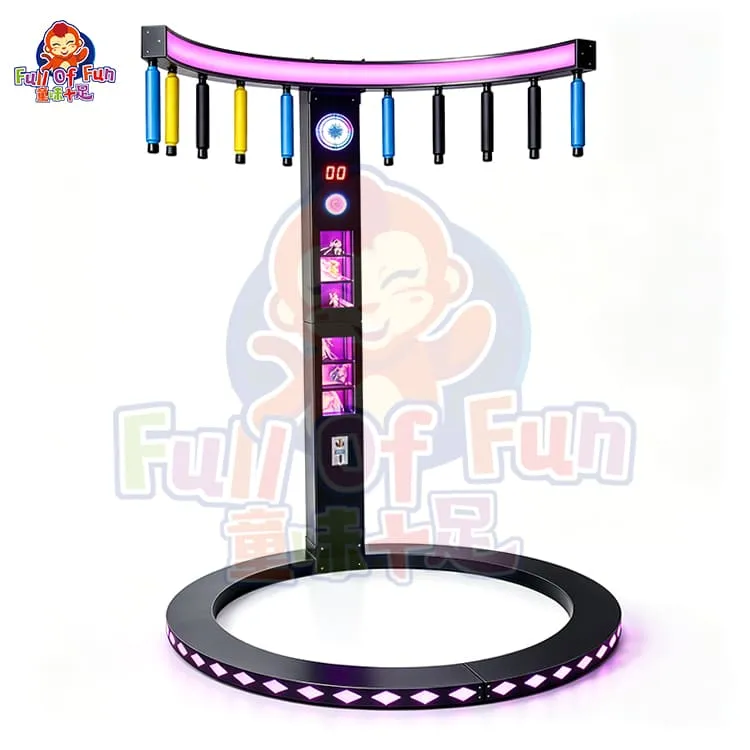
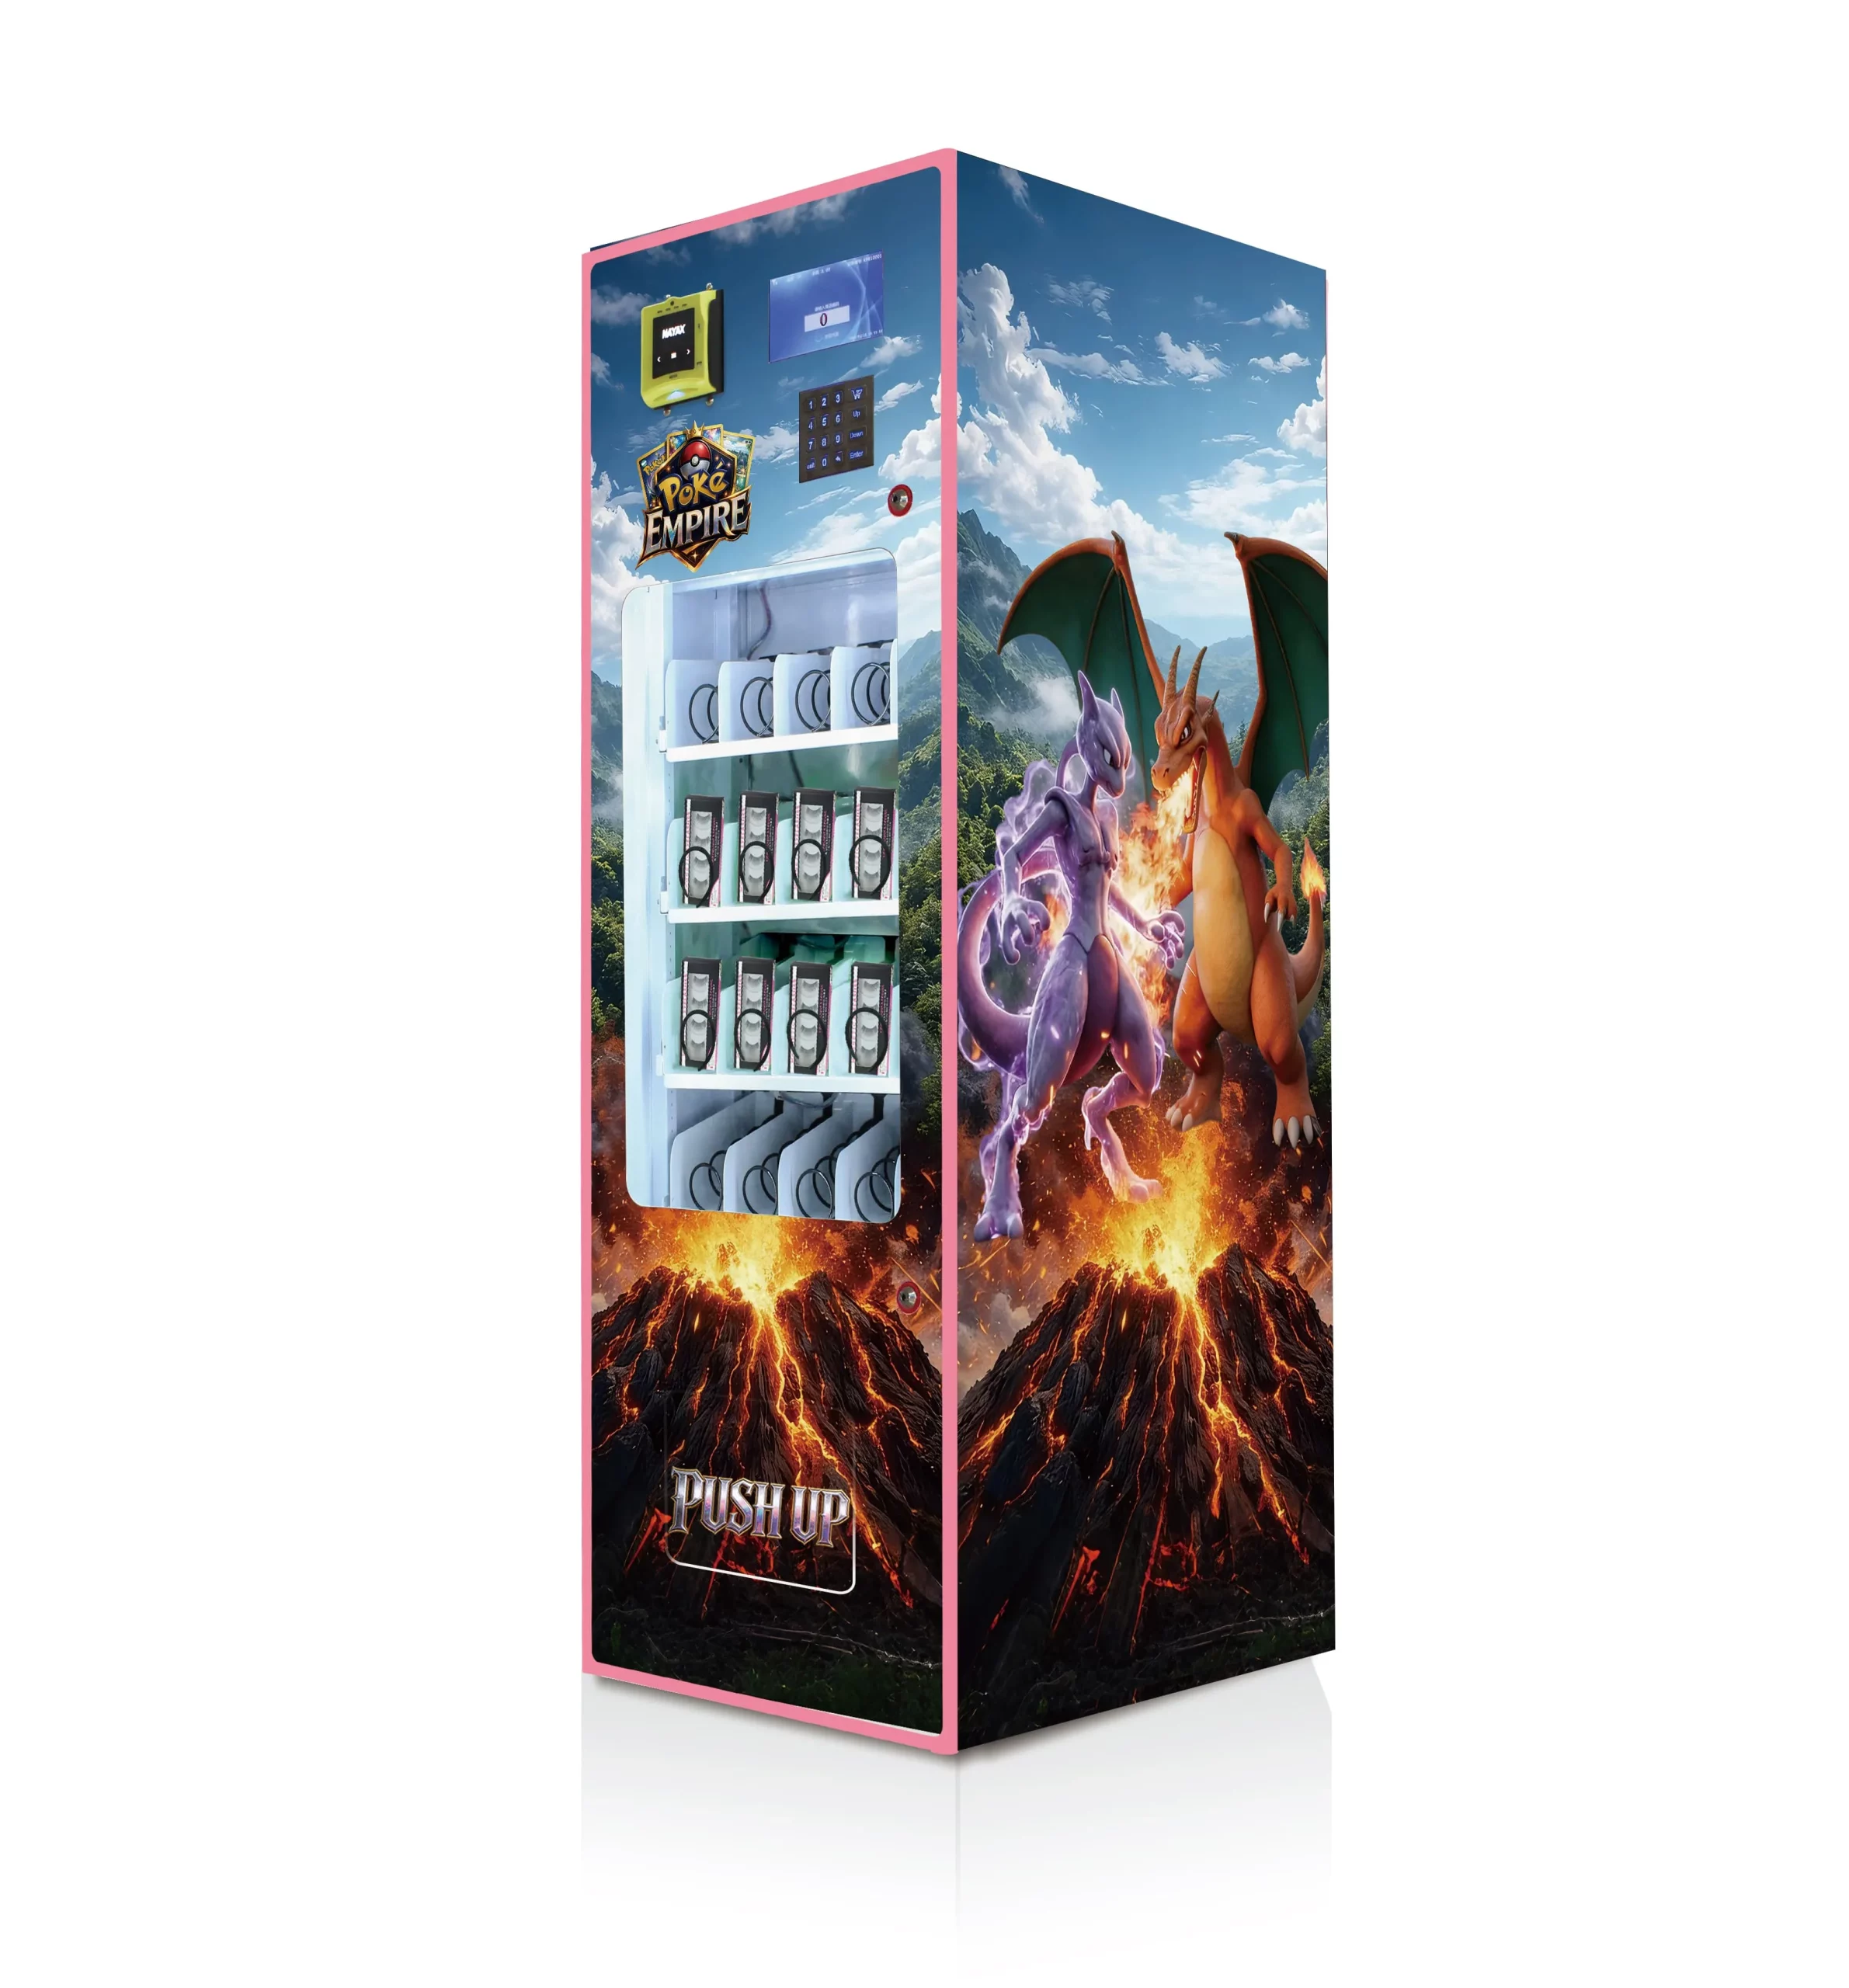
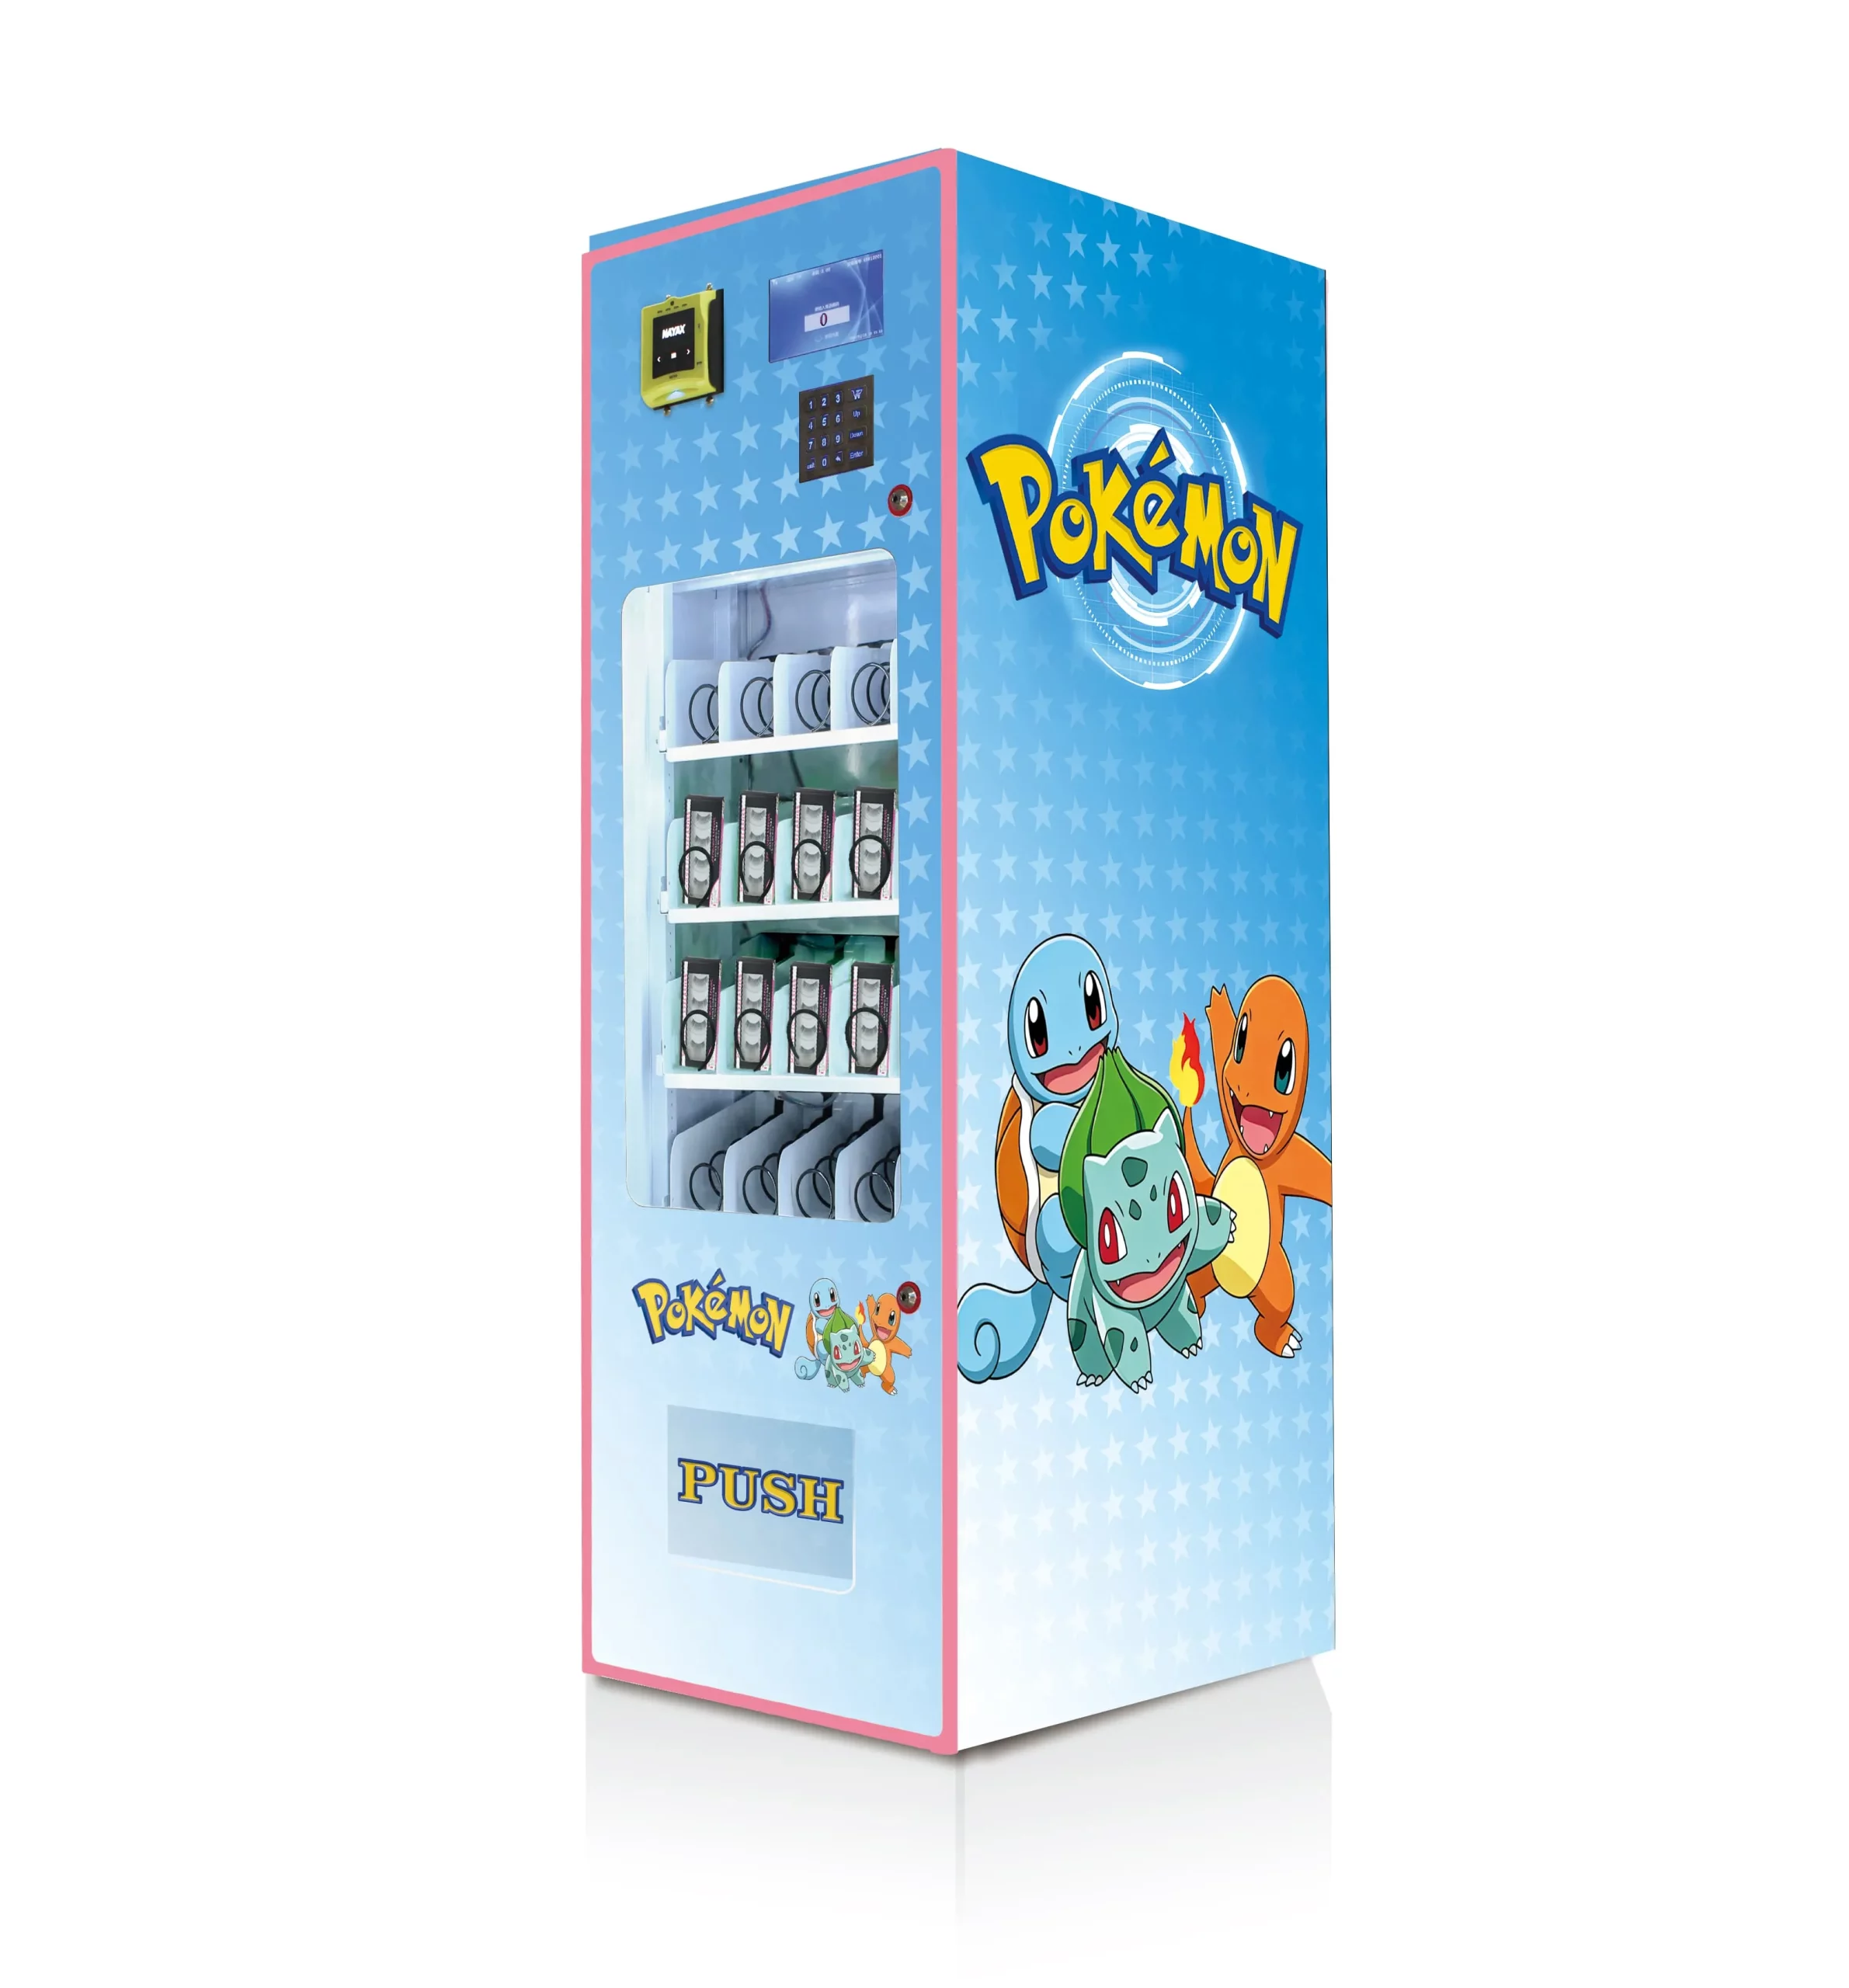
We manufacture a wide range of styles and configurations tailored for diverse commercial spaces. From dual-zone chilled beverage and snack setups to specialized retail systems, our designs maximize sales per square foot.
3. Comprehensive OEM/ODM Customization
We provide flexible OEM/ODM customization services to align perfectly with your business goals. We can customize everything from exterior branding and internal product configurations to specialized payment modules, creating a tailored solution for your brand.
4. Dedicated Technical Support and Extended Warranty
Every Full of Fun machine comes with comprehensive technical support and an all-inclusive 1-year warranty. Our technical team provides expert guidance at every stage—from machine selection and setup to ongoing operations—ensuring your investment delivers steady returns.
Accelerate Your Automated Retail ROI Today
Partnering with Full of Fun gives you access to commercial-grade equipment, competitive factory pricing, and dependable long-term support.
Contact our product team today to request a comprehensive catalog and a free freight quote. Let us help you build a highly profitable automated retail network.